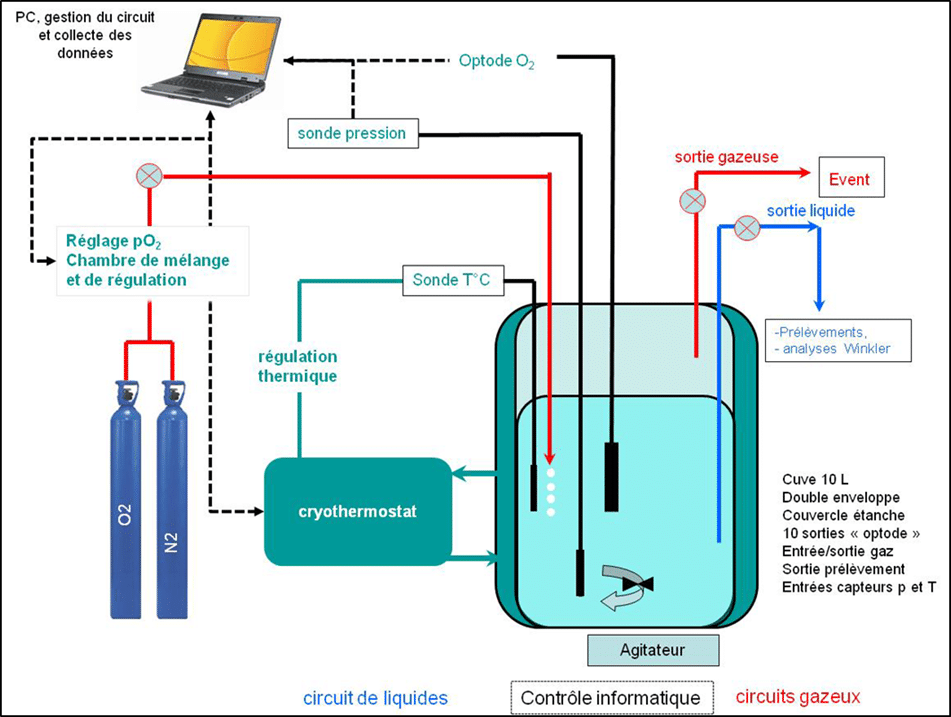
The optode calibration station for oxygen measurement was developed to validate the data provided by optodes on a large spatial and temporal scale with sufficient resolution.
The Calibration Station consists of a 10 litre tank that can simultaneously accommodate 4 optodes, including our reference optode, which has been in the bath since 2015. This tank is fitted with a double envelope containing glycol connected to a thermostatic bath that allows us to regulate the temperature of the tank. We have a pressure sensor inside the tank and a second one outside, enabling us to correct the pressure. Gas regulation is carried out by 2 flowmeters (an N2 flowmeter and an O2 flowmeter) coupled to a mixing chamber. Calibration is carried out in deionised water (salinity = 0).
We carry out coupled temperature/gas flow forcing for 30 defined stages, covering the oxygen concentration range: 30 - 400 µmol.Kg.-1 .
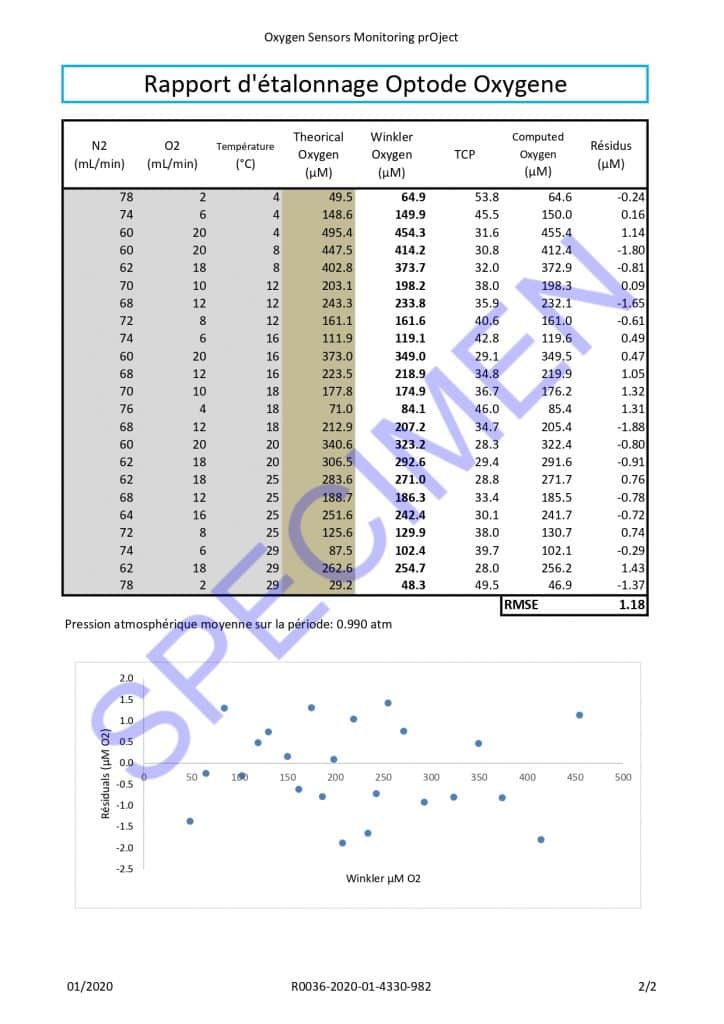
Winkler samples are taken in triplicate at each stage to validate the oxygen concentrations. The concentration values obtained from the Winkler samples are used to determine the new coefficients.
Estimation of new coefficients
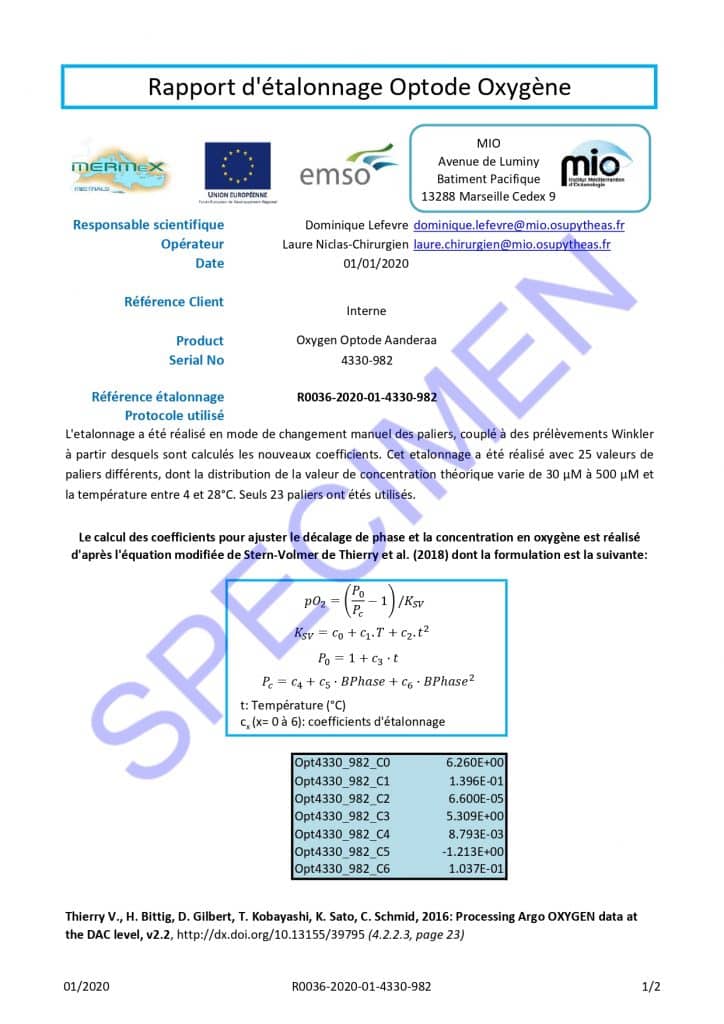
For Aanderaa optodes
The estimation of the coefficients to adjust the phase shift and oxygen concentration is performed according to the modified Stern-Volmer equation of Thierry et al. (2018) whose formulation is as follows:
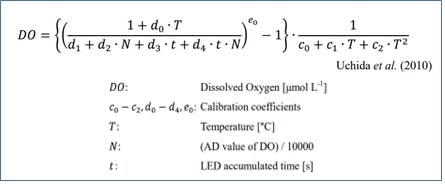
For Rinko optodes
The coefficients for adjusting the phase shift and oxygen concentration are estimated according to the formulation of Uchida et al (2010) as follows: